Learning the Customer Lifetime Value (CLV) formula will help marketers predict the future net profit of every customer in a contractual business and take action to improve the value of high-value customers across the business.
The formula to calculate the expected customer lifetime value for your contractual business as a marketer is:

Where EV(t) is the net income or Profit, S(t) is the survival probability or the retention rate, d is the discount rate, and t is the time period interval that you are using. Put another way, the definitional expression for expected customer lifetime value E(CLV) is:

Got it? Now good luck!
…Just kidding.
You probably need a bit more background to understand this equation and its underlying principles behind the formula so that you aren’t just plugging in numbers without understanding all of the moving parts.
Why should I care about calculating the expected customer lifetime value for my business’s customers?
In order to promote your business with marketing campaigns, you must spend resources such as time, effort, and capital to attract customers. You want to ensure that all of these resources spent aren’t for nothing. Wouldn’t it be great to have a crystal ball to see the future for every customer and their potential value, so you know which customers are worth your time and effort by the amount they may spend on your products or services?
While that kind of magical crystal ball doesn’t exist, determining a customer’s expected lifetime value comes in a close second for a similar usefulness. Yet, the calculation of the E(CLV) alone is not the end, since customer value is finite – no business relationship lasts forever. Simply giving every customer a potential value is not enough, since you may or may not gain the benefit of this customer depending on a number of determining factors.
The day you acquire a new customer, their potential value starts decreasing. You can lose potential value at any point if the relationship is burned too quickly, the partnership soured, or the customer leaves you to go to a competitor. While a customer might look very profitable at first glance with really high potential value, it is not always so easy to capture that potential. It’s also not likely that you will ever capture all the potential value of any single customer in the lifetime you have a business relationship with them.
So to answer the question – you should care about calculating the expected lifetime value of your business’s customers because you could be leaving money on the table by not properly reaching customers that have high potential value, and throwing money away by spending frivolous resources on customers with low potential value.
Looking at each individual customer in the marketplace in this potential value fashion is generally called customer centricity. The way you track, measure, and apply customer-centric strategies is a function of using the expected customer lifetime value E(CLV).
Focusing on the Heterogeneous (Truly Unique) Segments of Your Customers
Not all customers have equal potential value let alone the actual value they pay you at the first purchase. Focusing on User Experience (UX), personalization, and dynamic marketing campaigns create a common misconception that you are working with customer centricity. While those put the customer at the center of marketing – it is the function of incorporating the potential value through E(CLV) that truly defines customer centricity.
The focus of customer centricity should begin in your customer relationship management platform (CRM) with the segmenting of your customer information. If you’ve ever sorted coins into the pennies, nickels, dimes, quarters, etc. and counted them up, this is an example of what you will aim to do with the customers in your database (whose potential value is a lot like the different values of coins). You are going to separate your customers by potential value E(CLV) so that your entire company can better understand the different customer centric tiers your company works with.
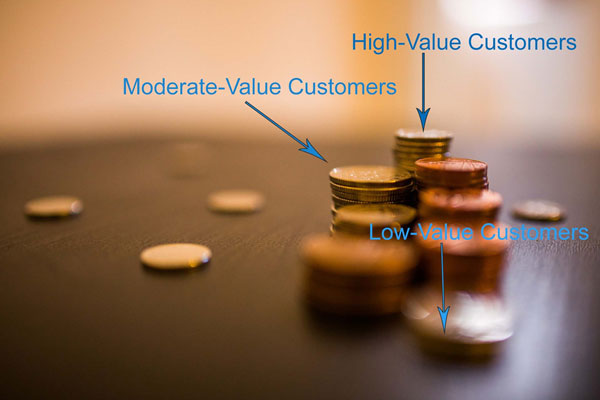
The segments (like the coins) should be heterogeneous so that every segment is different enough from each other (all dimes together, all pennies together, etc.). Within each group, you might expect to see a lot of aspects of the customers in common other than just similar expected customer lifetime ranges.
The simplest way to get started with segmenting your customers is to group them by three categories: high value (highest potential value), moderate value (average potential value), and low value (lowest potential value). The decision points (what will separate your segments) are highly subjective to you and your business, so pick the initial break points but expect to adjust them in the future.
(Tip: You might also want to segment the customers further, so the groups are even more distinct from each other. See example in the table below)
Here are some additional combinations alongside value tiers that are targetable with advertising:
| High-value Web Visitors | Moderate-value Interests | Low-value Industry |
| High-value Email Clickers | Moderate-value Genders | Low-value Age Groups |
| High-value Asset Downloaders | Moderate-value Income Level | Low-value Geographic Area |
| High-value In-market for X | Moderate-value Job Title | Low-value Products Purchased |
After you have your segments, what do you see? Looking at your high potential value customers, do you see accounts that:
- Have been loyal?
- Tend to interact with your communications?
- Come to view you as a partnership?
- Own more than one of your products or services?
- Maximize the use of your products or services?
- Tend to refer your business to others?
You could look at each tier of customers this way and start asking these initial questions. The enlightening part of this journey is that once you start to ask the right questions, the solutions, processes, and marketing campaigns start to reveal themselves. Every business has the constraints of resources and capabilities, but once you see what composes your individual customers, you can efficiently act to capture additional value.
How to get started in order to calculate the expected customer lifetime value
Whether you are a marketer or in some other position, you should not be a lone wolf in attempting to make your company more customer-centric. It’s important that you manage your expectations and realize that you cannot do it alone forever – you need buy-in from the top and from the stakeholders in your organization because customer centricity is not localized to marketing or finance alone.
With that said, here are the basic components you will need to be able to calculate the E(CLV):
- Your business must be contractual (subscription based), or you must be able to tie purchases to individual customers. If you are not able to, while it’s still possible to figure out their E(CLV), it’s far more theoretical and I will not be tackling that in this article (but feel free to reach out if you want guidance).
- You must have and use a CRM (like Salesforce or similar) and;
- The CRM must store customers uniquely (little to no duplication).
- The CRM must contain the status of the customer’s relationship (Ex: current customer, cancelled customer, or prospective customer) along with dates of those status changes.
- The CRM (or you must have a way to match it to customers from another system) must contain the revenues and expenditures (think Net Profit or Net Cash Flow) of each of your current and cancelled customers broken down by your desired time periods (so not a single number in aggregate).
- The heterogeneous segments in your CRM must be as unique and distinct from each other as possible.
- Finally, the CRM must contain a large enough sample of the status type of cancelled/discontinued customers for you to get a healthy prediction since it will be based on this.
- You must have access to all of the information above and meet with finance infrequently to obtain a useful discount rate.
- Lastly, you must have a way to calculate it. Start with Excel, and maybe ask someone for help (like the author of this article!) if you need it.
When calculating the expected customer lifetime value, you are using the present and historical customer data in your CRM to make a calculated prediction about the future and potential value of your customer segments. You are using the cancelled customers in your segments as the baselines for the survival (retention) rates in each segment. This alone is why segments that are not unique enough from each other will abstract the final calculation of E(CLV).
(Tip: To find out if your segments are not unique enough, try segmenting further with data you have in your CRM by experimenting with different combinations such as demographics or behavioral engagements that you have tracked.)
Customers you have newly acquired may also skew results because they have not been customers long enough to give you quality data. For companies that are brand new, it’s more important that you set yourself up for calculating this in the future than it will be to get an accurate calculation in the first year.
Setting up your tables in Excel to calculate the expected customer lifetime value
As long as you are within the row and column limits of your Excel you can calculate the expected customer lifetime value and graph the results. The following example table is how you should organize the data out of your CRM:
| Segment | Time (t) | Profit(EV(t)) | Survival/Retention S(t) | Discount rate (d) | E(CLV) |
| High | 1 | $$$$ | 0.## | 0.## | $$ |
| Med | 1 | $$$ | 0.## | 0.## | $$ |
| Low | 1 | $$ | 0.## | 0.## | $$ |
On the top you want to label your columns (I’ve added formulaic representations to help you). On the left are your dimensions with segments listed and the corresponding time periods. You want to make sure that for each segment you have all the periods aligned with that segment. The Profit is the net cash flow for that period of time (Revenues – Expenditures – Taxes). Remember that this value is subjective to your organization and could be computed differently by company. Finally, add your survival probability (retention rate) and the discount rate (you should get this from finance).
Enter the E(CLV) formula that mentioned at the beginning into the final column and make sure that it pulls from the cells in its own row. Once the formulas run, you should see your E(CLV) amounts by segment and time period.
How do I calculate the customer survival probability (retention rate)?
The survival probability or the retention rate is how likely that segment is to survive into the next period. To get the survival probability (retention rate) for each period you will look at the historical information you have and use the following calculations based on the data in your CRM:

You can only do this calculation if you have the statuses of who is a prospective customer, a current client, and a cancelled customer.
As you can see, the major decider of a high or low survival rate (retention rate) is the amount of cancelled customers you had in each time period. From this metric alone you might be able to notice seasonal patterns or buying trends depending on how aggregated your time period is.
The life of finance circles around annual periods that are broken up by quarters (Q1, Q2, Q3, and Q4), but could also turn into months (1, 2, 3, …12) or weeks (1, 2, 3, 4, …52). The time period is sensitive to how quality your data is and the volume of how much data you have per segment. The more aggregate you go (annual, quarters), the more context you lose. Yet, the finer you go (days, weeks), the more quality data you need to have. Again, this is one of those areas that is subjective to your business.
I’ve calculated E(CLV) for my segments, now what?
First things first, give yourself a pat on the back, share your success here on the blog or let us know on social media that you’ve accomplished this, because we’d like to applaud your efforts. In terms of businesses who are capable of the feat of calculating customer value – you rank in the top globally.
If you have not already, graph your results of expected lifetime value.
(Tip: I recommend a waterfall chart to start as it gives you a nice little representation of the values over your time periods).
I created simulated information on my own so that I could share the results and talk about the value in obtaining this data. Below you will find the simulation results that I ran for two segments (Cohort A, and Cohort B).
Cohort A is akin to a high-value customer segment. Cohort B is similar to that of a low-value customer segment (These two are sort of like dividing your customer value database into two).
The shocking difference is just how much better the high-value customers are than the low-value customers.
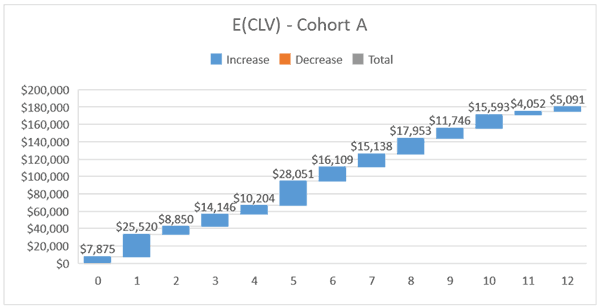
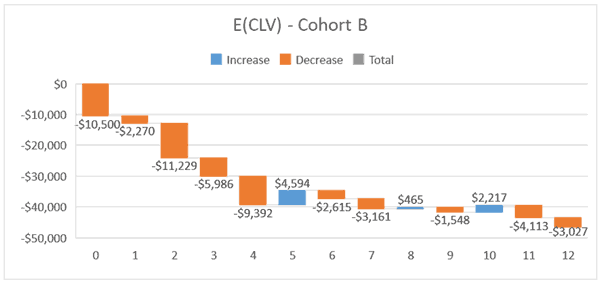
I was shocked to see that in this simulation, the Cohort A (high-value segment) is light years better than the Cohort B (low-value segment). In fact, the low-value segment is actually losing money over time and unable to make up for the initial acquisition cost.
Combined, the customers are net profit $133K per year (12 t periods) – so on the surface, this simulation wouldn’t appear that bad. However, when we segment the simulation into two groups, we see that the Cohort A carries all the weight with $180k per year in profits and Cohort B is dragging all of the profits down. What would you do if you found out this was happening in your customers?
Now, not so fast… do not fall into the trap of wanting to remove all of the bad customers you have that are unprofitable until you properly examine their contributions.
A good example is when a grocery store finds out that all of its high-value customers are those that buy soda, chips, and diapers. Taking this insight, it decides to turn the entire store into offering only soda, chips, and diapers. The sales plummet, and customers leave in droves. But wait – isn’t that what the best customers wanted? So why didn’t that strategy work?

It does not work because even though customers may have preferences, loyalties, and behaviors that you can measure, they also want the opportunity to do more. Customers may not have been buying products outside of soda, chips, and diapers at high frequency, but they were still buying them. They weren’t coming solely for the soda, chips, and diapers – even if those purchases are most common.
Your least valuable customers might be that way because of your past decisions, alignment, and even the products or services you sell. Instead of sending all your low-value customers away, you should think about ways to reorganize their products, services, and offerings so that you can make them more profitable to your valuable customer. The lesson in your actual data can tell you a lot about customer behavior, customer insights, and how you go to market.
Next Steps?
The next step you should take is to try to go more granular with your segments if possible. You should also try your first experiments to see if you can affect the segments directly.
Finally, I would recommend that you take your expected customer lifetime value and apply backwards to all of the activities in your organization that directly and clearly impact the customer. You might find (for example) that your phone calls (with rich customer data and highly personal communication) have a high potential value across all your customers. If you knew that a phone call was associated with tons of customer value, that would be a sign that your phone is not only important but possibly vital (high correlation) to the success of creating value from your current and future customers.
(Tip: CallSource is the phone call attribution pro so ask us for help if you need it.)
Conclusions
Customers are all created with potential value that you can realize by segmenting your CRM by expected customer lifetime value. Expected customer lifetime value is a financial calculation that forecasts the potential value of a customer based on the present and historical data you have of current and cancelled customers.
Using the formula, you can predict the future value of a customer discounted to the present period. Businesses that focus on customer-centricity are aligned from top to bottom in using the expected customer lifetime value across their entire organization. The day a customer is created starts the clock on your ability to capture that value over time with targeted marketing and sales strategies.
Customer centricity is not a short-term or “get rich quick” proposition and requires your company to take accountability for the CRM and customer data. By using potential customer value, you can efficiently use your company’s valuable resources and capabilities to generate higher returns.
References:
- 2018 by Peter S. Fader and Sarah E. Toms, The Customer Centricity Playbook, Wharton University Press
- 2007, Estimating CLV using aggregated data: The Tuscan Lifestyles case revisited, Fader P.S., Hardie B.G.S., Jerath K., Journal of Interactive Marketing, 21 (3), pp. 55-71.


